by Nick
Posted on 30 November, 2016
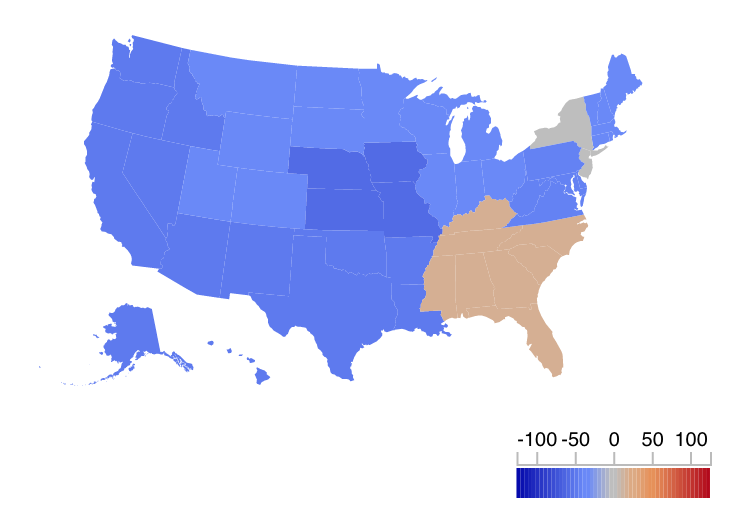
We updated our U.S. influenza forecasts on Tuesday, November 29th. (We tend to update the forecasts on Mondays, but the CDC data release was delayed this week due to Thanksgiving last week.) Overall, the data and the short-term forecasts for flu are showing regional circulation of flu that is a bit below the CDC-defined baseline levels. The two exceptions are in HHS Region 2 (NY and NJ) which is right at its baseline level, according to the most recent data from the CDC (reported through November 19th), and HHS Region 4 (the southeastern corner of the US) which already has risen above its baseline. Region 4 has historically had somewhat earlier seasons than the rest of the US. Check out our interactive FluSight app for more details on each region.
Reported U.S. regional influenza incidence in Nov 13-19 (MMWR week 46), 2016. Colors show percent above or below baseline:
Last week, I gave a quick under-the-hood look at how we make our forecasts. This week, I’m going to interpret more directly our forecasts for this week.
Our model is currently combiing predictions from three component models to deliver a single forecast. Depending on the region, it is combining the predictions with different weights. One thing that we’ve noticed is that the seasonal auto-regressive integrated moving average (SARIMA) model is a bit more “jumpy”, or willing to predict a rapid increase than the other models. This year, it has shown mixed performance. For example, last week it predicted upticks in Regions 2 and 4 that were almost exactly right. However, it also predicted upticks in Regions 3 and 6 that were wrong.
These are early assessments of prediction accuracy, and they may change, as the CDC often does update its data over the course of a few subsequent weeks. See for example this example of data reported in week 52 of 2015 (dark line with dots in the figure below) that was subsequently adjusted down (solid green line):
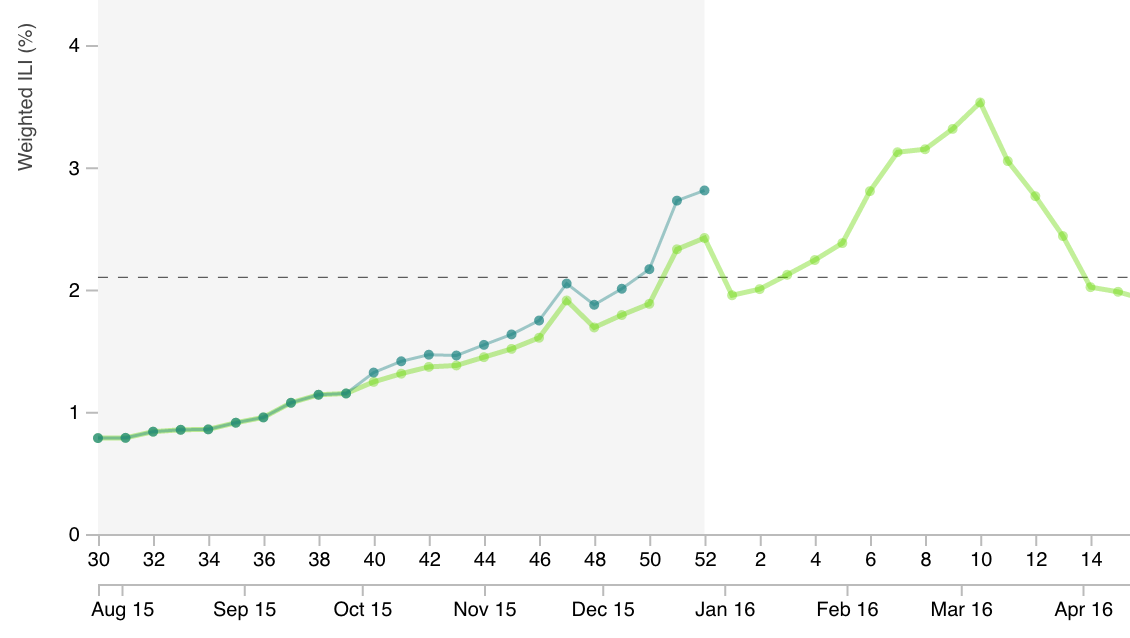 This “backfill” issue (adjustment of reported data in weeks following the initial report) is not something that we have yet accounted for in our forecasts, although it is on the short-list of issues to add to our development model that will be udpated throughout the season.
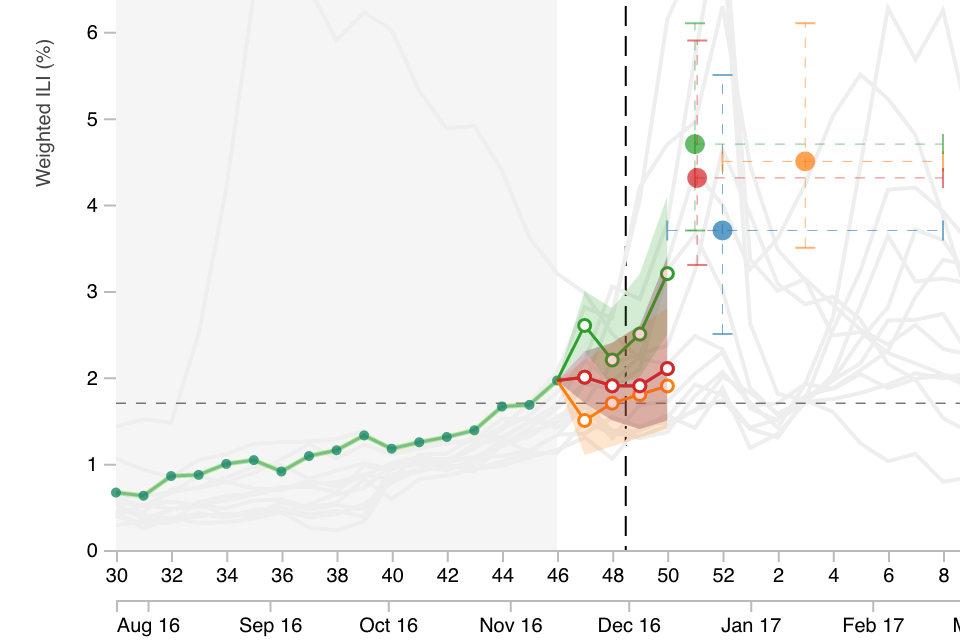
In most regions, our ensemble model is sticking closely to the KCDE model for its weekly forecasts. The figure below, showing our current forecasts for Region 4, highlights how the red predictions (ensemble model) overlay the blue predictions (KCDE) almost exactly. For now, the ensemble is resisting the urge to follow the urgency of the green SARIMA model or the conservatism of the orange model which is pulling the trajectory back towards a seasonal average:
Stay tuned for periodic updates throughout the season!