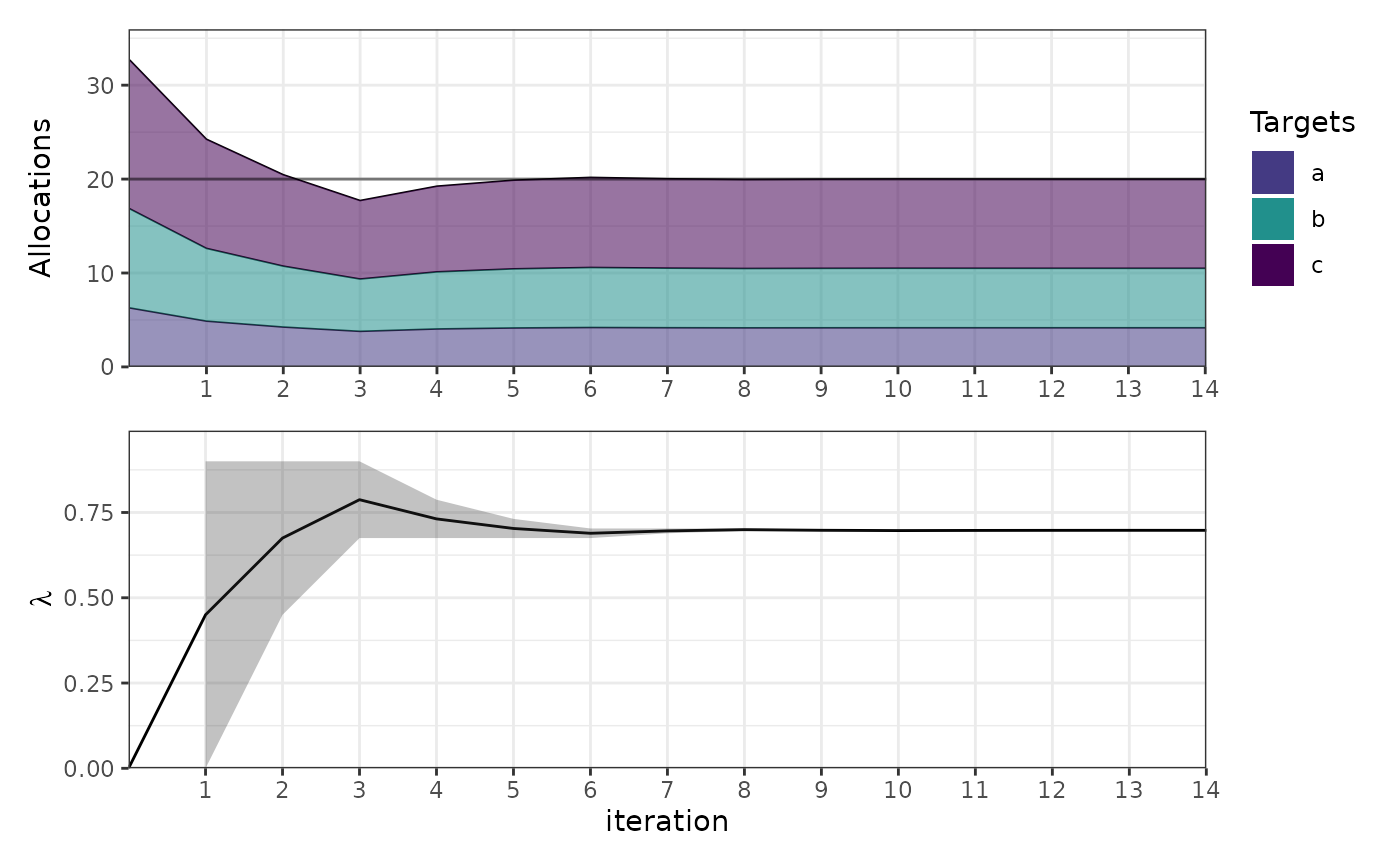
Shows how the allocation evolved over the bisection on lambda, as a stacked area of allocations above a panel tracking lambda and its bracketing interval.
Usage
plot_iterations(
  adf,
  K_to_plot = NULL,
  itnum = NULL,
  num_targets_to_color = 6,
  target_palette = (scales::viridis_pal())(num_targets_to_color + 1)
)
Arguments
- adf
an
allocatedobject; seeallocate().- K_to_plot
the budget whose search to show. Required unless
adfhas a single row.- itnum
how many iterations to show. Defaults to all of them.
- num_targets_to_color
how many of the largest targets to colour individually; the rest are pooled into "other".
- target_palette
colours for the individually coloured targets.
Value
A patchwork::patchwork object stacking the two panels.
Examples
fc <- add_pdqr_funs(
  tibble::tibble(
    target_names = c("a", "b", "c"), dist = "norm",
    mean = c(5, 8, 12), sd = c(1, 2, 3)
  ),
  types = c("p", "q")
)
plot_iterations(allocate(fc, K = 20, alpha = 0.9))
#> Warning: Removed 1 row containing missing values or values outside the scale range
#> (`geom_ribbon()`).