Plot forecasts and optional truth for only one selected target variable.
Source:R/plot_forecasts.R
plot_forecasts.RdFaceted plots for multiple models, locations and forecast dates are supported with specified facet formula.
plot_forecasts(
  forecast_data,
  truth_data = NULL,
  hub = c("US", "ECDC", "FluSight"),
  models = NULL,
  target_variable = NULL,
  locations = NULL,
  facet = NULL,
  facet_scales = "fixed",
  facet_nrow = NULL,
  facet_ncol = NULL,
  forecast_dates,
  intervals,
  horizon,
  truth_source,
  use_median_as_point = FALSE,
  plot_truth = TRUE,
  plot = TRUE,
  fill_by_model = FALSE,
  fill_transparency = 1,
  truth_as_of = NULL,
  top_layer = c("truth", "forecast"),
  title = "default",
  subtitle = "default",
  show_caption = TRUE
)
Arguments
- forecast_data
required data.frame with forecasts in the format returned by
load_forecasts()- truth_data
optional data.frame from one truth source in the format returned by
load_truth(). It needs to have columnsmodel,target_variable,target_end_date,location and value.Modelcolumn can be"Observed Data (a truth source)".- hub
character vector, where the first element indicates the hub from which to load forecasts. Possible options are
"US","ECDC"and"FluSight".- models
vector of strings specifying models to plot. Default to all models in
forecast_data.- target_variable
string specifying target type. It should be one of
"cum death","inc case","inc death","inc hosp"and"inc flu hosp"."cum death"and"inc hosp"are only available in forecasts from US hub now. If there is only onetarget_variableinforecast_data, this parameter is optional.- locations
a vector of strings of fips code or CBSA codes or location names, such as "Hampshire County, MA", "Alabama", "United Kingdom". A US county location names must include state abbreviation. Default to
NULLwhich would include all locations inforecast_data.- facet
interpretable facet option for ggplot. Function will error if multiple locations are passed in without location in the facet formula.
- facet_scales
argument for scales in ggplot2::facet_wrap. Default to
"fixed".- facet_nrow
number of rows for facetting; optional.
- facet_ncol
number of columns for facetting; optional.
- forecast_dates
date string vectors for forecast dates to plot. Default to forecast_dates present in the data.
- intervals
values indicating which central prediction interval levels to plot.
NULLmeans only plotting point forecasts. If not provided, it will default toc(.5, .8, .95). When plotting 6 models or more, the plot will be reduced to show .95 interval only.- horizon
forecasts are plotted for the horizon time steps after the forecast date. Default to all available horizons in
forecast_data.- truth_source
character specifying where the truth data will be loaded from if
truth_datais not provided. Currently support"JHU","NYTimes","HealthData"and"ECDC". Optional iftruth_datais provided.- use_median_as_point
logical for using median quantiles as point forecasts in plot. Default to
FALSE.- plot_truth
logical for showing truth data in plot. Default to
TRUE. Data used in the plot is eithertruth_dataor data loaded fromtruth_source.- plot
logical for showing the plot. Default to
TRUE.- fill_by_model
logical for specifying colors in plot. If
TRUE, separate colors will be used for each model. IfFALSE, only blues will be used for all models. Default toFALSE.- fill_transparency
numeric value used to set transparency of intervals. 0 means fully transparent, 1 means opaque.
- truth_as_of
the plot includes the truth data that would have been in real time as of the
truth_as_ofdate (not using this parameter when truth data is from github repo)- top_layer
character vector, where the first element indicates the top layer of the resulting plot. Possible options are
"forecast"and"truth".- title
optional text for the title of the plot. If left as
"default", the title will be automatically generated. If"none", no title will be plotted.- subtitle
optional text for the subtitle of the plot. If left as
"default", the subtitle will be automatically generated. If"none", no subtitle will be plotted.- show_caption
logical, if
TRUE, caption will be included showing data sources
Value
invisible ggplot object
Examples
# load forecasts from US forecast hub
us_forecasts <- load_latest_forecasts(
models = c(
"COVIDhub-ensemble", "COVIDhub-baseline",
"JHU_CSSE-DECOM", "CovidAnalytics-DELPHI",
"LANL-GrowthRate", "Microsoft-DeepSTIA"
),
last_forecast_date = "2021-07-21",
forecast_date_window_size = 6,
locations = "US",
types = c("point", "quantile"),
targets = paste(1:4, "wk ahead inc case"),
source = "zoltar"
)
#> get_token(): POST: https://zoltardata.com/api-token-auth/
#> get_resource(): GET: https://zoltardata.com/api/projects/
#> get_resource(): GET: https://zoltardata.com/api/project/44/models/
#> get_resource(): GET: https://zoltardata.com/api/project/44/timezeros/
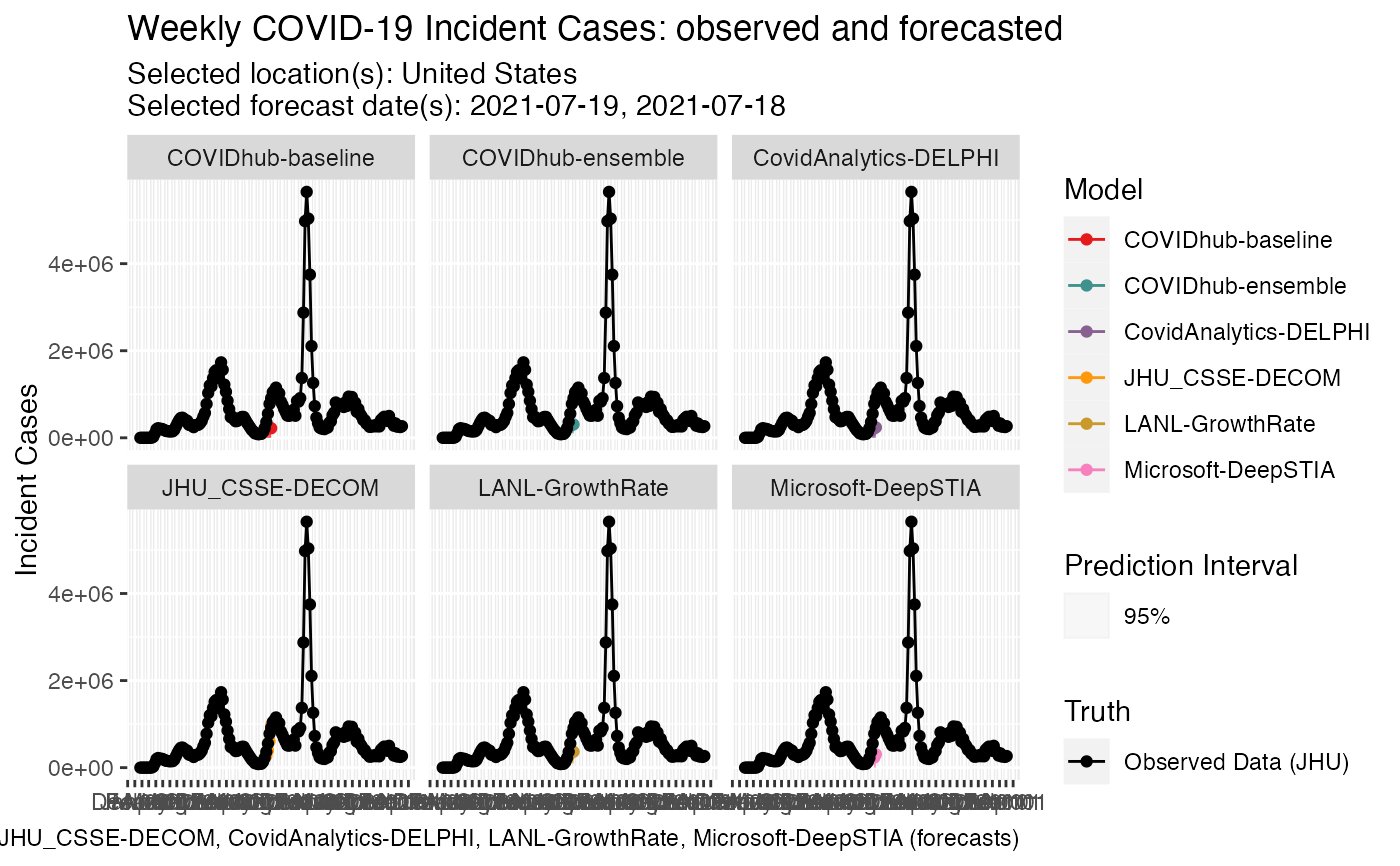
# plot
plot_forecasts(
forecast_data = us_forecasts,
models = c(
"COVIDhub-ensemble", "COVIDhub-baseline", "JHU_CSSE-DECOM",
"CovidAnalytics-DELPHI", "LANL-GrowthRate", "Microsoft-DeepSTIA"
),
target_variable = "inc case", locations = c("US"), intervals = c(.95),
horizon = 4, truth_source = "JHU", plot = TRUE, fill_by_model = TRUE,
facet = ~model, facet_scales = "fixed", title = "default",
show_caption = TRUE
)
#> Scale for colour is already present.
#> Adding another scale for colour, which will replace the existing scale.
 # load forecasts from ECDC forecast hub
ecdc_forecasts <- load_latest_forecasts(
models = c("ILM-EKF"),
hub = c("ECDC", "US"), last_forecast_date = "2021-03-08",
forecast_date_window_size = 0,
locations = c("GB"),
targets = paste(1:4, "wk ahead inc death"),
source = "zoltar"
)
#> get_token(): POST: https://zoltardata.com/api-token-auth/
#> get_resource(): GET: https://zoltardata.com/api/projects/
#> get_resource(): GET: https://zoltardata.com/api/project/238/models/
#> get_resource(): GET: https://zoltardata.com/api/project/238/timezeros/
#plot
plot_forecasts(
forecast_data = ecdc_forecasts,
hub = c("ECDC", "US"),
locations = "GB",
truth_source = "JHU",
top_layer = c("forecast")
)
#> Scale for colour is already present.
#> Adding another scale for colour, which will replace the existing scale.
# load forecasts from ECDC forecast hub
ecdc_forecasts <- load_latest_forecasts(
models = c("ILM-EKF"),
hub = c("ECDC", "US"), last_forecast_date = "2021-03-08",
forecast_date_window_size = 0,
locations = c("GB"),
targets = paste(1:4, "wk ahead inc death"),
source = "zoltar"
)
#> get_token(): POST: https://zoltardata.com/api-token-auth/
#> get_resource(): GET: https://zoltardata.com/api/projects/
#> get_resource(): GET: https://zoltardata.com/api/project/238/models/
#> get_resource(): GET: https://zoltardata.com/api/project/238/timezeros/
#plot
plot_forecasts(
forecast_data = ecdc_forecasts,
hub = c("ECDC", "US"),
locations = "GB",
truth_source = "JHU",
top_layer = c("forecast")
)
#> Scale for colour is already present.
#> Adding another scale for colour, which will replace the existing scale.
