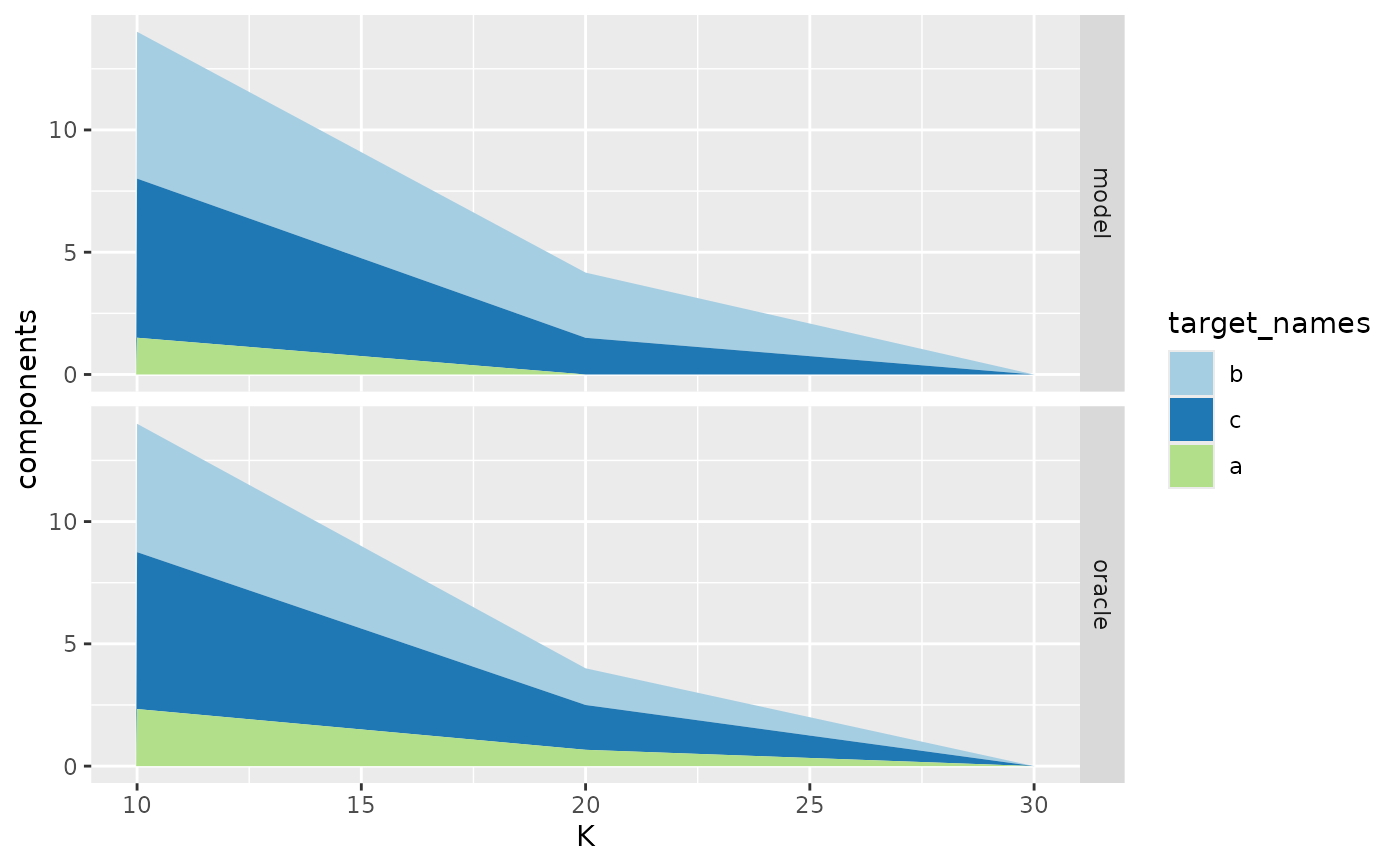
Shows how a score decomposes across targets: as stacked or dodged bars when a single budget is plotted, and as stacked areas over the budget otherwise.
Usage
plot_components(...)

# Default S3 method
plot_components(
  df,
  Ks = NULL,
  scored_col_name = "scored",
  origin_time_col_name = NULL,
  model_col_name = NULL,
  target_col_name = NULL,
  show_oracle = TRUE,
  ...
)

# S3 method for class 'allocated'
plot_components(
  ...,
  Ks = NULL,
  origin_time_col_name = NULL,
  model_col_name = NULL,
  target_col_name = NULL,
  show_oracle = TRUE
)
Arguments
- ...
objects to plot. For the default method, a data frame with a list column of scored allocations; for the
allocatedmethod, one or more scoredallocatedobjects.- df
a data frame with a list column of scored allocations.
- Ks
budgets to plot. Defaults to
NULL, which keeps all of them; note that the bar layout requires a single budget.- scored_col_name
name of the list column holding the scored allocations.
- origin_time_col_name
name of the column holding an origin time, used to facet.
- model_col_name
name of the column holding a model name. For hubverse model output this is
"model_id".- target_col_name
name of the column holding target names.
- show_oracle
whether to add the oracle's components as an extra model.
Value
A ggplot2::ggplot() object.