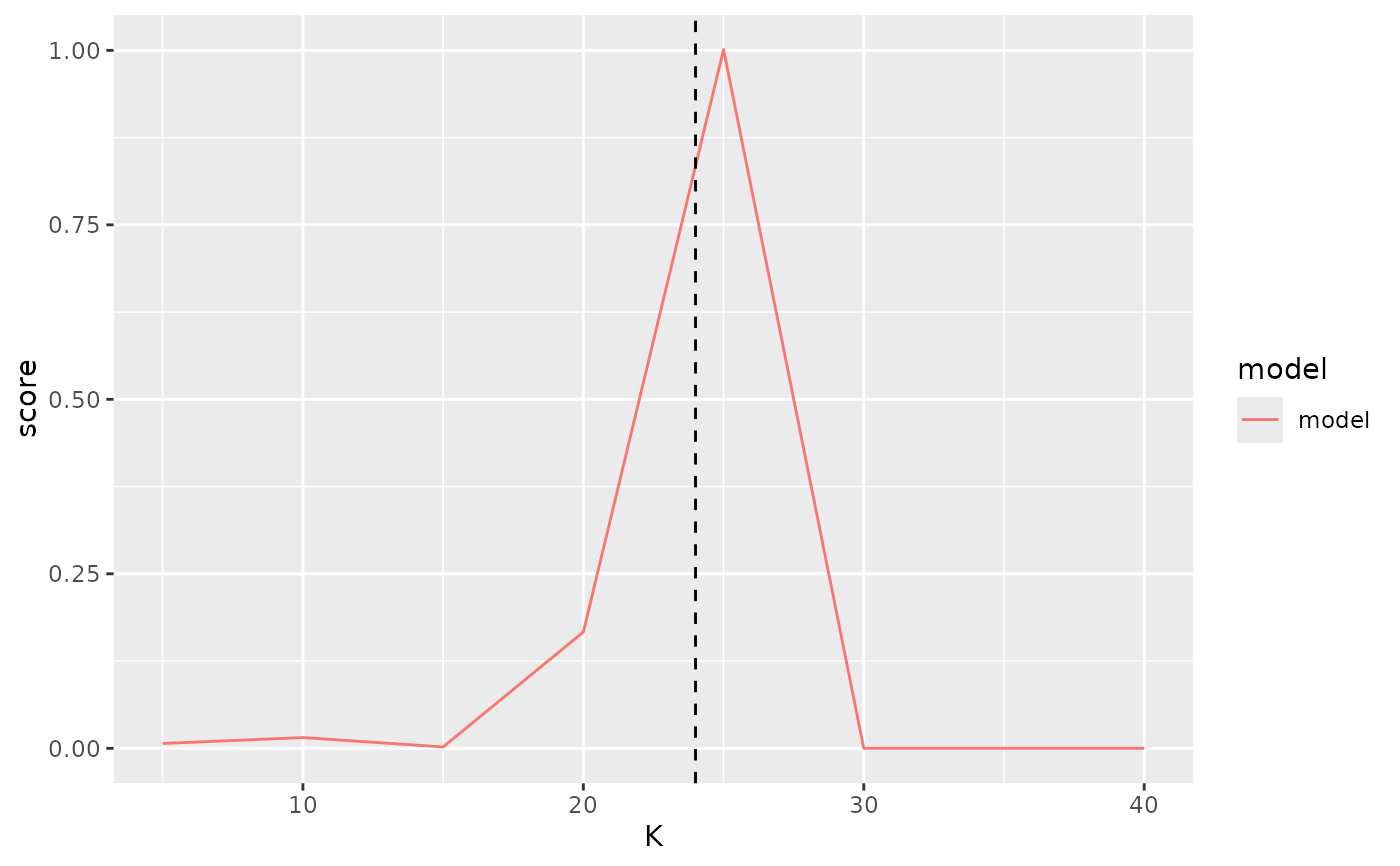
Plot allocation scores against the budget or over time
Usage
plot_scores_slim(
  slim_df,
  Ks = NULL,
  ts = FALSE,
  ts_dates = NULL,
  origin_time_col_name = NULL,
  model_col_name = NULL,
  target_col_name = NULL,
  show_oracle = FALSE,
  show_raw = FALSE,
  order_at_K = NULL,
  order_at_model = NULL,
  order_at_origin_time = NULL,
  palette = NULL,
  linetypes = NULL,
  ytot = TRUE
)
Arguments
- slim_df
a slim scored allocation; see
slim().- Ks
budgets to plot. Defaults to
NULL, which keeps all of them; note that the bar layout requires a single budget.- ts
plot the score as a time series over
origin_timerather than against the budget. Requires one budget per origin time, given inKs.- ts_dates
restrict a time series plot to these origin times.
- origin_time_col_name
name of the column holding an origin time, used to facet.
- model_col_name
name of the column holding a model name. For hubverse model output this is
"model_id".- target_col_name
name of the column holding target names.
- show_oracle
whether to add the oracle's components as an extra model.
- show_raw
plot the forecaster's own losses rather than its losses relative to the oracle.
- order_at_K, order_at_model, order_at_origin_time
order the targets by their contribution at this budget, model or origin time. By default the targets are ordered over the whole data set.
- palette
colours for the models, passed to
ggplot2::scale_color_manual().- linetypes
line types for the models, passed to
ggplot2::scale_linetype_manual().- ytot
add a dashed vertical line at the total weighted outcome, the budget beyond which the oracle incurs no loss.
Value
A ggplot2::ggplot() object.