by Nick
Posted on 28 November, 2017
In March 2017, a group of influenza forecasters who have participated in the CDC FluSight challenge in past seasons established the FluSight Network, a multi-institution and multi-disciplinary consortium of forecasting teams. This group worked throughout 2017 to create a public, real-time collaborative ensemble forecasting model that provides updated forecasts of influenza in the US each week.
Every flu season since 2013/2014, the CDC has organized a challenge where, each week from early November through mid April, teams submit forecasts about the flu season in the US. For every week in a season, each submission contains forecasts for seven targets of public health interest specified by the CDC for each of the 11 HHS regions. The region-level targets are: the fraction of doctor’s visits where due to influenza-like-illness in each of the next four weeks of the season, the week of season onset, the week in which the peak wILI occurs, and the level of the peak wILI. The forecasts themselves are text files containing, in a specified format, data that encode predictive distribution for these targets.
Throughout this project, the central question has been can we provide better information to decision makers by combining forecasting models, and specifically by using past performance of the component models to inform the ensemble approach. All previous participants in FluSight challenges were invited to join the FluSight Network. Four groups decided to participate and contributed 21 models in total using a diverse array of methodologies, including kernel conditional density estimation, Bayesian state-space models, simple seasonal models, auto-regressive models for time-series, and susceptible-infectious-recovered-susceptible compartmental models, to name just a few.
| Institution | No. of models | Team leaders |
|---|---|---|
| Delphi team at Carnegie Mellon | 9 | Logan Brooks, Roni Rosenfeld |
| Columbia University | 7 | Teresa Yamana, Sasikiran Kandula, Jeff Shaman |
| Los Alamos National Laboratory | 1 | Dave Osthus |
| Reich Lab at UMass-Amherst | 4 | Nicholas Reich, Abhinav Tushar, Evan Ray |
Prior to the start of the 2017/2018 influenza season in the US (first submissions were due on November 6), we assembled these 21 distinct forecasting models for influenza, each with forecasts from the last seven influenza seasons in the US. (To the extent possible, these forecasts were only allowed to use data available at the time the forecasts were made.)
Subsequently, we conducted a cross-validation study to compare five different methods for combining these models into a single ensemble forecast. Specifically, this was done by leaving one season out at a time, fitting each ensemble model based on the remaining seasons’ data, and generating ensemble forecasts for each week of the left-out season. Then, we evaluated and compared the performance of the ensemble models.
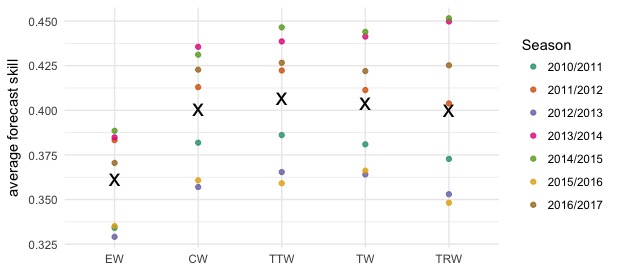
All of our ensemble models are built by taking weighted averages of the component models. We examined the performance of five different possible ensemble specifications (see table below). The “equal weights” model takes a simple average of all of the models, with no consideration of past performance. The other four approaches estimated weights for models based on past performance, using the degenerate EM algorithm.
| Model | No. of weights | description |
|---|---|---|
| Equal weights (EW) | 1 | Every model gets same weight. |
| Constant weights (CW) | 21 | Every model gets a single weight, not necessarily the same. |
| Target-type-based weights (TTW) | 42 | Two sets of weights, one for seasonal targets and one for weekly wILI targets. |
| Target-based weights (TW) | 147 | Seven sets of weights, one for each target separately. |
| Target-and-region-based weights (TRW) | 1,617 | Target-based weights estimated separately for each region. |
We measured performance by computing the average score across all targets and all relevant weeks in the last seven seasons. (Including only “relevant weeks” means, e.g., that for evaluating season onset we exclude weeks after the onset has clearly occured, because at this point, the forecasts are no longer informative.) The ensemble models generally showed better average scores than any of the component models, and there was little difference between the CW, TTW, TW, and TRW models.
For submitting in real-time in 2017-2018, we selected the ensemble model that achieved the best overall score in the cross-validation experiment over the last seven seasons. This was the target-type-based model (TTW) that assigned one set of weights to each component model for the weekly incidence targets and another set of weights for the seasonal targets (onset timing, peak timing, and peak incidence).