by Nick
Posted on 24 May, 2017
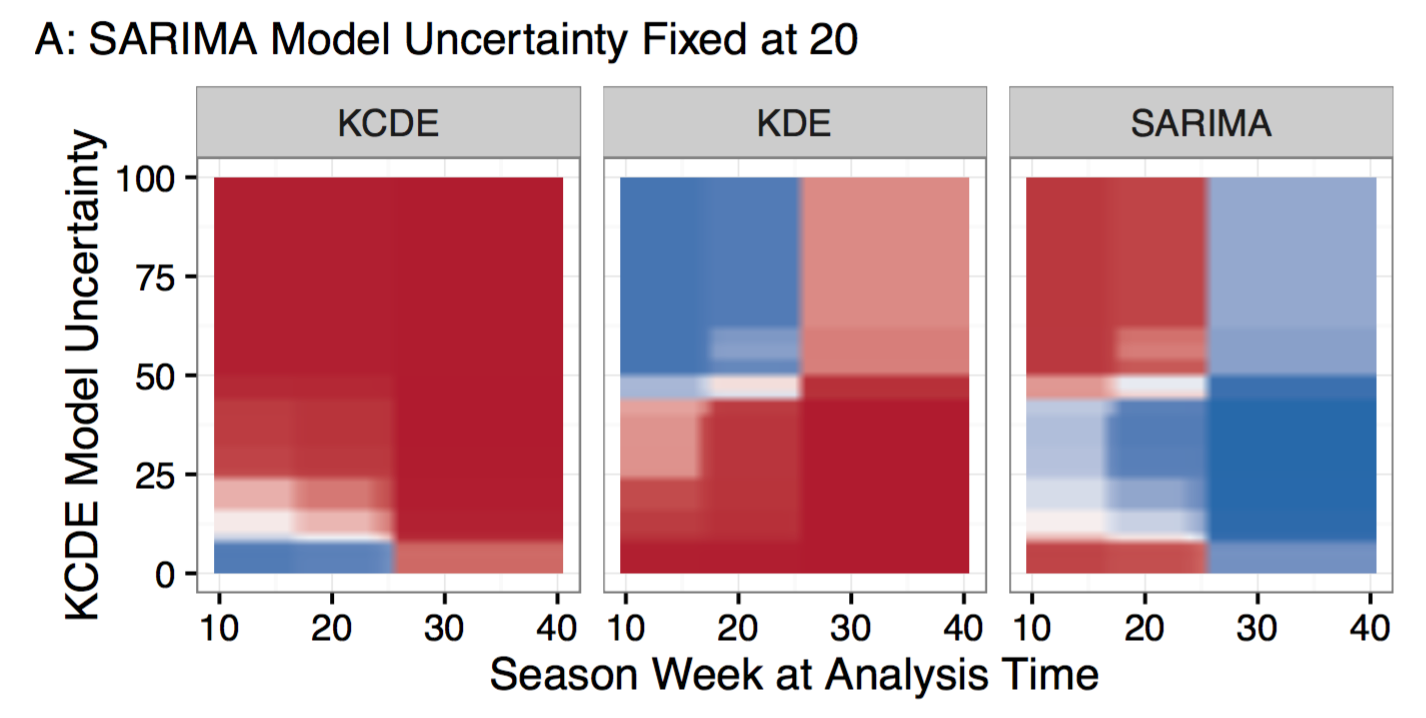
Here are the slides for my presentation today at the annual MIDAS conference in Atlanta, GA. The talk summarizes recent work led by post-doc Evan Ray on creating interpretable “feature-weighted density ensembles” for infectious disease forecasting. The paper is currently under review, but the preprint is available on arXiv. Check out the 2017-2018 real-time influenza forecasts from this model available on our flusight app. And here are some slices of the feature-dependent weighting functions for predicting peak incidence for influenza in the U.S.
by Nick
Posted on 14 May, 2017
I wrote a response to Siddhartha Mukherjee’s article “A.I. vs. M.D.” that appeared in the New Yorker last month. While I submitted it as a letter to the editor, they didn’t publish it. In retrospect, perhaps it was a bit long-winded for their curt and pithy letters section. Mukherjee’s article was published on the heels of Evan submitting his latest work on improving the consistency of infectious disease prediction using interpretable model averaging methods. What follows is the letter I submitted.
by Nick
Posted on 30 November, 2016
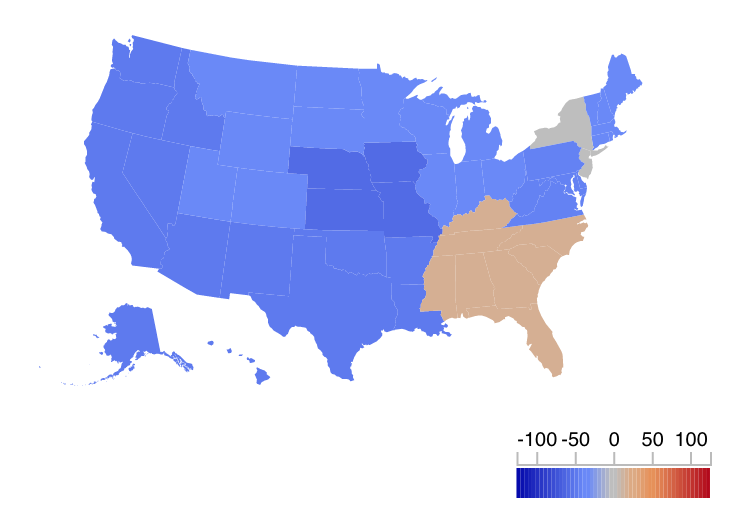
We updated our U.S. influenza forecasts on Tuesday, November 29th. (We tend to update the forecasts on Mondays, but the CDC data release was delayed this week due to Thanksgiving last week.) Overall, the data and the short-term forecasts for flu are showing regional circulation of flu that is a bit below the CDC-defined baseline levels. The two exceptions are in HHS Region 2 (NY and NJ) which is right at its baseline level, according to the most recent data from the CDC (reported through November 19th), and HHS Region 4 (the southeastern corner of the US) which already has risen above its baseline. Region 4 has historically had somewhat earlier seasons than the rest of the US. Check out our interactive FluSight app for more details on each region.
Reported U.S. regional influenza incidence in Nov 13-19 (MMWR week 46), 2016. Colors show percent above or below baseline:
by Nick
Posted on 23 November, 2016
For the second year in a row, the Reich Lab is participating in the CDC FluSight challenge, a project where teams from around the country submit real-time predictions of influenza to the CDC. The teams use a variety of different models and methods to generate these predictions, from an empirical Bayes method that uses Google search data to a extended Kalman-filter method that uses humidity data to our kernel conditional density estimation method using recent incidence, and there are many others!
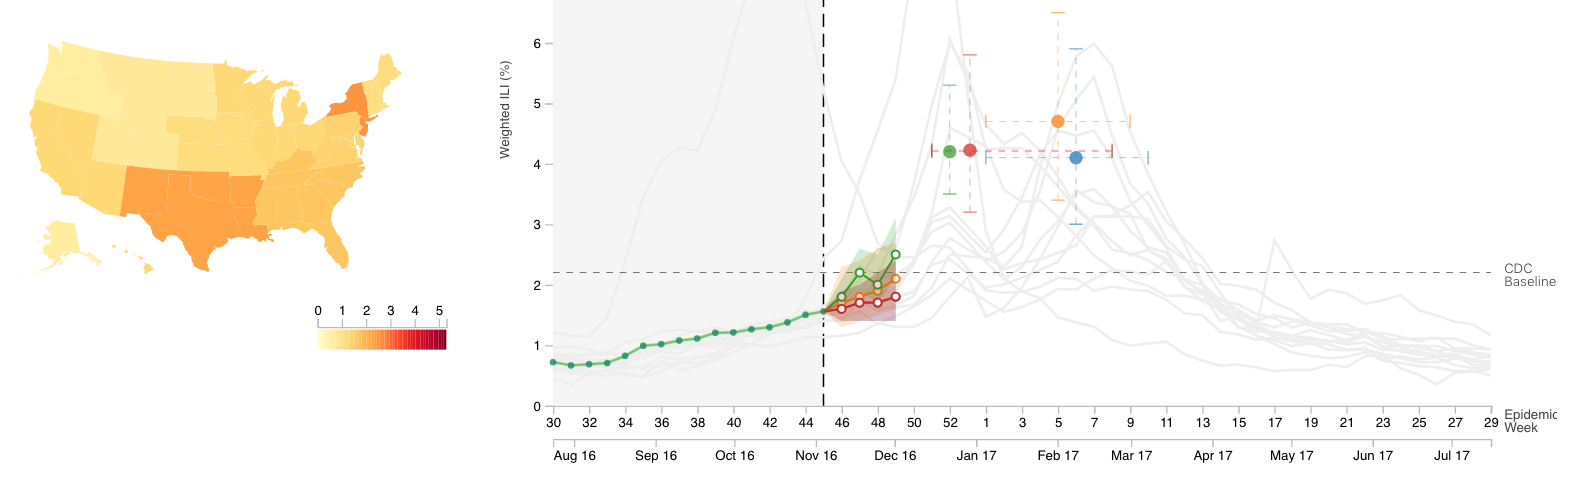
This year, we – well, mostly Evan – have developed a new ensemble method that combines predictions from different models. We – mostly Abhinav – also created a visualizer for our predictions. Check it out here! It’s still early in the season, and we’re not seeing much data to suggest that this will be an unusually high or low year, but that’s largely because there just isn’t much information in the early-season data. In this post, I’m going to give you a quick tour under the hood of our ensemble forecasting methodology. At some point, we’ll have an article up on GitHub or arXiv, but for now, this explanation will have to suffice.
by Nick
Posted on 01 September, 2016
This week I attended a workshop at the CDC about last year’s FluSight challenge, a competition that scores weekly real-time predictions about the course of the influenza season. They are planning another round this year and are hoping to increase the number of teams particiating. Stay tuned to this site for more info.
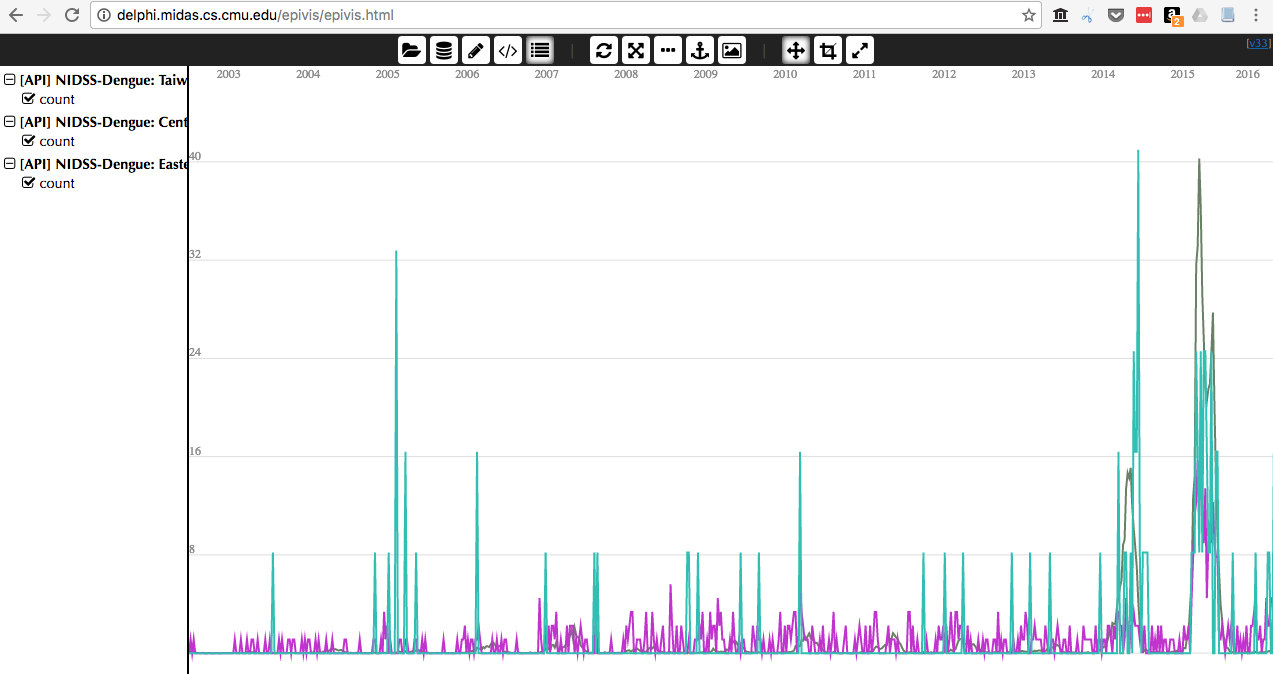
At the workshop, I learned about DELPHI’s real-time epidemiological data API. The API is linked to various data sources on influenza and dengue, including US CDC flu data, Google Flu Trends, and Wikipedia data. There is some documentation and minimal examples, and this post documents a more robust and complete example for using the API via R. I’ll note that the CDC’s influenza data, can also be accessed via the cdcfluview R package, which I’m not going to discuss here and I will focus here on accessing some of the other data sources. Here’s a teaser of this data that you can also interactively explore on the DELPHI EpiVis website: